Note
Access to this page requires authorization. You can try signing in or changing directories.
Access to this page requires authorization. You can try changing directories.
Workspace monitoring gives you log-level visibility for all items in a workspace, including pipelines. It stores execution logs in a monitoring eventhouse so you can query and analyze them using KQL (Kusto Query Language).
Enable workspace monitoring
In your Fabric workspace, select Workspace Settings, then select the Monitoring tab.
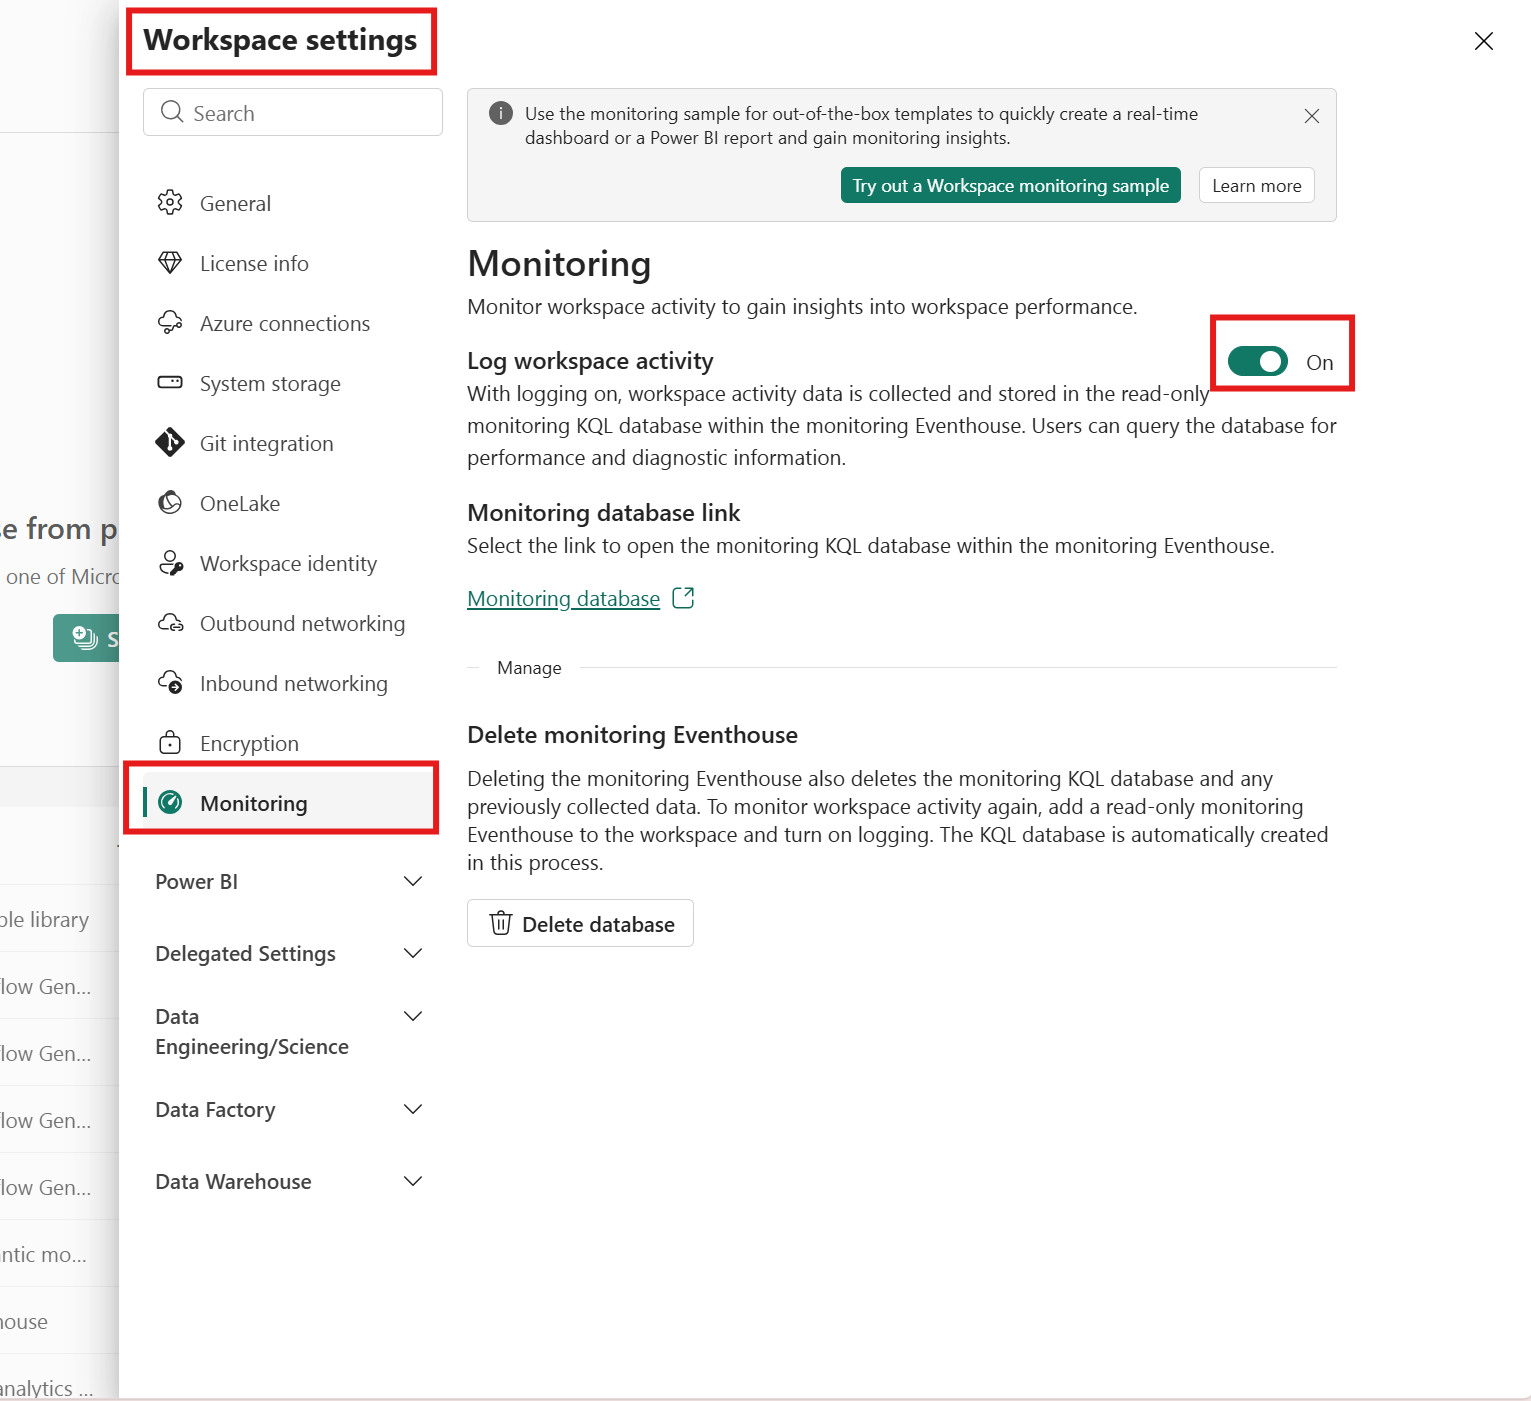
Turn on Log workspace activity. This creates an eventhouse in your workspace to store logs. Fabric also creates a read-only KQL database inside the eventhouse for monitoring data.
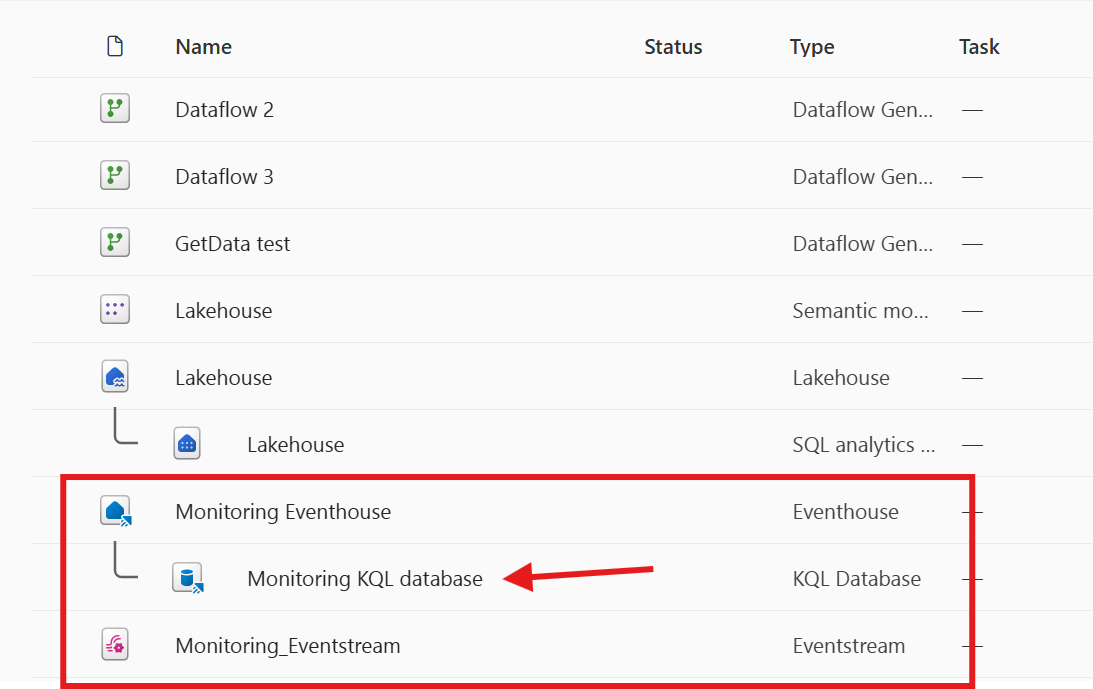
Go to the KQL database. You can find it in the Monitoring database link within the monitoring settings or in your workspace.
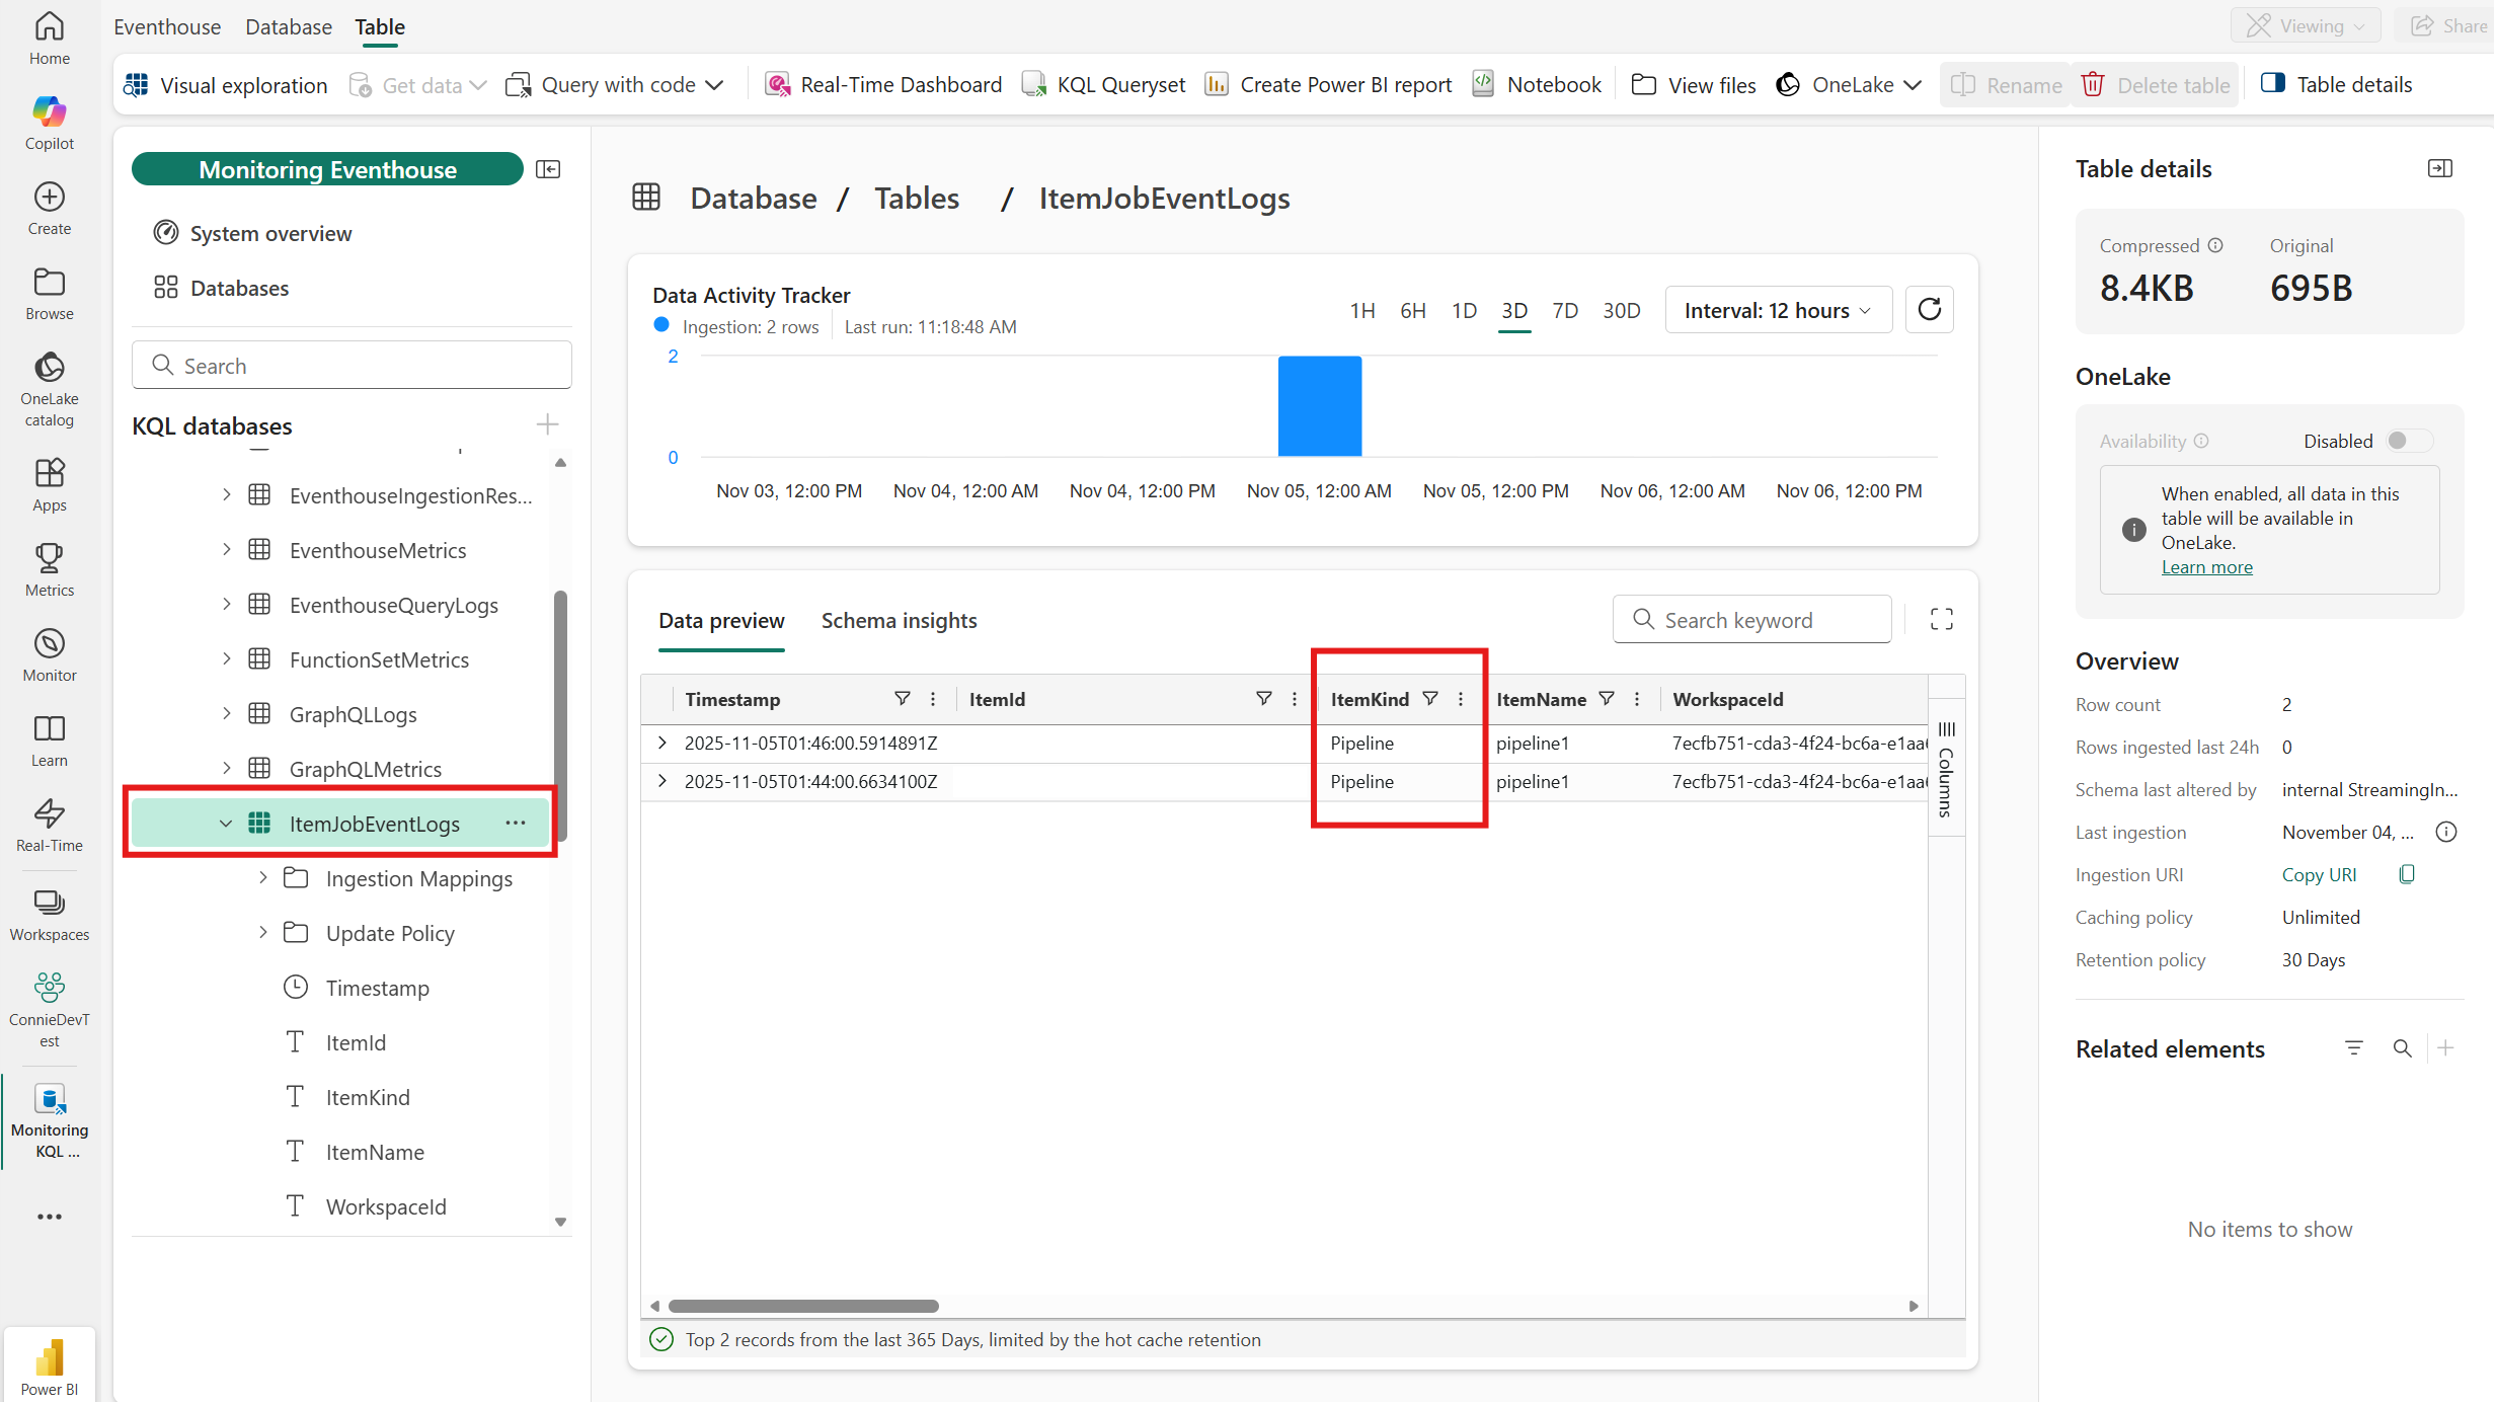
In the KQL database, the ItemJobEventLogs table captures pipeline-level events from your workspace. Logs include pipeline name, run status, timestamps, and system diagnostics.

Review logged data
The ItemJobEventLogs table includes:
- Pipeline name
- Run status (Success/Failed)
- Start and end timestamps
- System diagnostics
Note
Currently, workspace monitoring supports L1 monitoring (pipeline-level). Activity-level (L2) monitoring isn't available yet.
Query logs
- Go to the monitoring eventhouse.
- Use KQL queries to analyze:
- Success and failure trends
- Performance metrics
Here's an example query:
ItemJobEventLogs
| where ItemKind == "Pipeline"
| summarize count() by JobStatus
Use query logs to create an alert for workspace-wide pipeline failures
Use a KQL Queryset to detect pipeline failures across the workspace. Here is an example query that returns recent failures:
ItemJobEventLogs
| extend SecondsAgo = datetime_diff('second', now(), ingestion_time())
| where JobType == 'Pipeline' and JobStatus == 'Failed'
| where SecondsAgo <= 540
| order by Timestamp desc
| project Timestamp, ItemName, WorkspaceName, JobStartTime, JobEndTime, JobStatus
ItemJobEventLogs schema
The following table describes the schema of ItemJobEventLogs:
| Column name | Column type | Description |
|---|---|---|
| Timestamp | datetime | The timestamp (UTC) when the log entry was generated. |
| ItemId | string | Unique ID of the item that's logging the data. |
| ItemKind | string | Type of item that's logging the operation. |
| ItemName | string | The name of the Fabric item that's logging this operation. |
| WorkspaceId | string | Unique identifier of the Fabric workspace that contains the item. |
| WorkspaceName | string | The name of the workspace that contains the item. |
| CapacityId | string | Unique identifier of the capacity that hosts the item. |
| DurationMs | long | Amount of time in milliseconds taken by the job. |
| ExecutingPrincipalId | string | User ID or service principal ID that runs the job. |
| ExecutingPrincipalType | string | User or service principal that runs the job. |
| WorkspaceMonitoringTableName | string | The name of the table where records belong. |
| JobInstanceId | string | Unique identifier of the job instance. |
| JobInvokeType | string | On demand or scheduled. |
| JobType | string | Job type. Values are listed in the job type table above. |
| JobStatus | string | Status of the job. Values can be Not started, In progress, Completed, or Failed. |
| JobDefinitionObjectId | string | ID of the scheduler that triggered the job. |
| JobScheduleTime | datetime | Scheduled job start time. |
| JobStartTime | datetime | Actual job start time. |
| JobEndTime | datetime | Actual job end time. |
Best practices
- Use workspace monitoring for deep analysis and custom reporting.
- Combine workspace monitoring with the monitoring hub for quick operational checks across workspaces.