Note
Access to this page requires authorization. You can try signing in or changing directories.
Access to this page requires authorization. You can try changing directories.
Real-time dashboards show key metrics, help you spot anomalies, and let you make fast, informed decisions. By using Copilot, you can use natural language to explore the live data behind your entire dashboard, specific visuals, or in KQL tables. Ask questions, refine visuals, and uncover and share insights without needing to use KQL query language.
After exploring data by using Copilot, save insights to the dashboard for quick access, view streaming or near real-time updates, and share them with your team.
Important
This feature is in preview.
Note
Currently, Copilot-assisted data exploration in real-time dashboards supports dashboards with a single data source and View mode only.
Prerequisites
- A workspace with a Microsoft Fabric-enabled capacity.
- A dashboard with visuals. Learn more in Create a real-time dashboard.
Explore dashboards with Copilot
Use Copilot to explore data in the context of the entire dashboard or of a specific visual. Ask questions about the overall data, request summaries, or seek insights that span multiple visuals. For example, you can change the time frame, filter by a column or value, calculate an average or total, or group by a column. Each time you explore the data with Copilot, you can view the data updates in Copilot, and when ready you can save the insights as a new visual in the dashboard or share them with others.
In your Fabric workspace, select a real-time dashboard, or create a new dashboard, and ensure you're in Viewing mode.
By default, the Copilot pane opens in the context of the entire dashboard. You can ask questions and explore insights based on the entire dashboard data. You can also explore data in the context of a specific visual.


Ask a question about the data. For example, "What are the top 5 event types?" or "Which state had the most events?".
Continue exploring and drilling through the data by asking follow-up questions or making more requests.
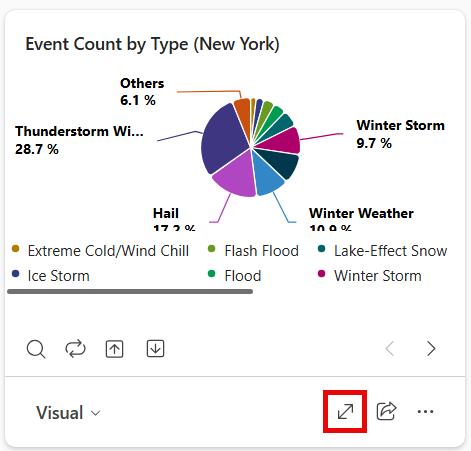
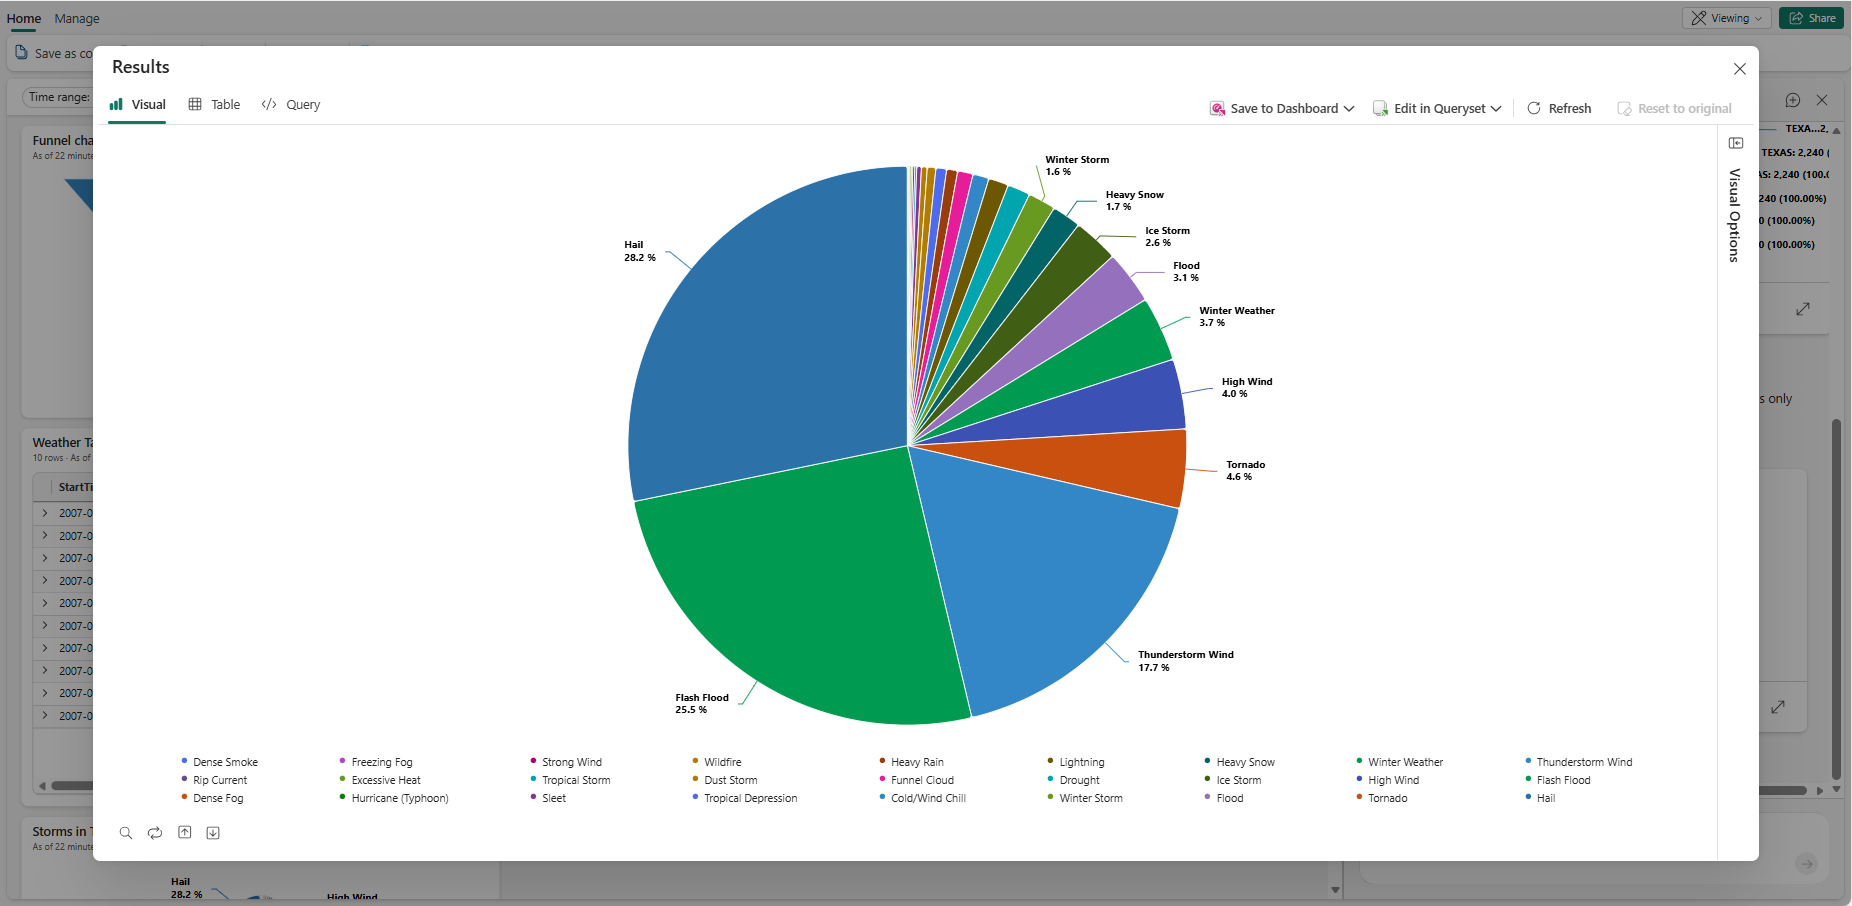
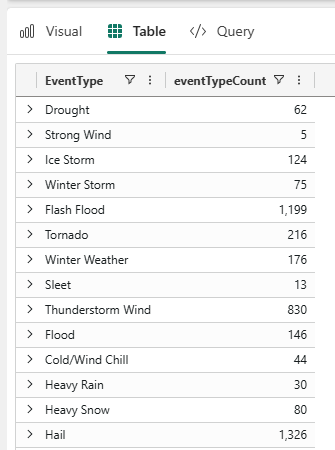
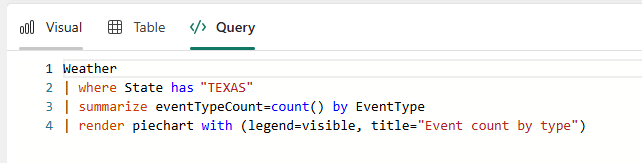
The filtered data appears in the Copilot pane. Select the expand icon to see the results reflected in the Visual, Table, and Query tabs.
Continue exploring and drilling through the data by asking more questions or modifying the visual manually using the Visual Options pane. For more information on customizing the visual, see Customize Real-Time Dashboard visuals.
When you're ready to save your insights to the dashboard, select Save to dashboard. This action saves the current view and query as a new tile on the dashboard. Optionally, you can save the tile to a different existing dashboard or create a new dashboard for the tile. Each saved tile stays connected to your live data, so as the data updates, your visual does too.

Contextual Copilot data exploration
In addition to exploring data in the context of the entire dashboard, you can also explore data in the context of a specific visual. The visual provides context for your questions, so you can refer to it naturally (for example, “this chart” or “these results”). Copilot uses that context to analyze the broader dataset behind the dashboard, not just the selected visual. You can then save those insights as a new visual on the dashboard or share them with others.
Select the Copilot icon on the visual to explore the data.

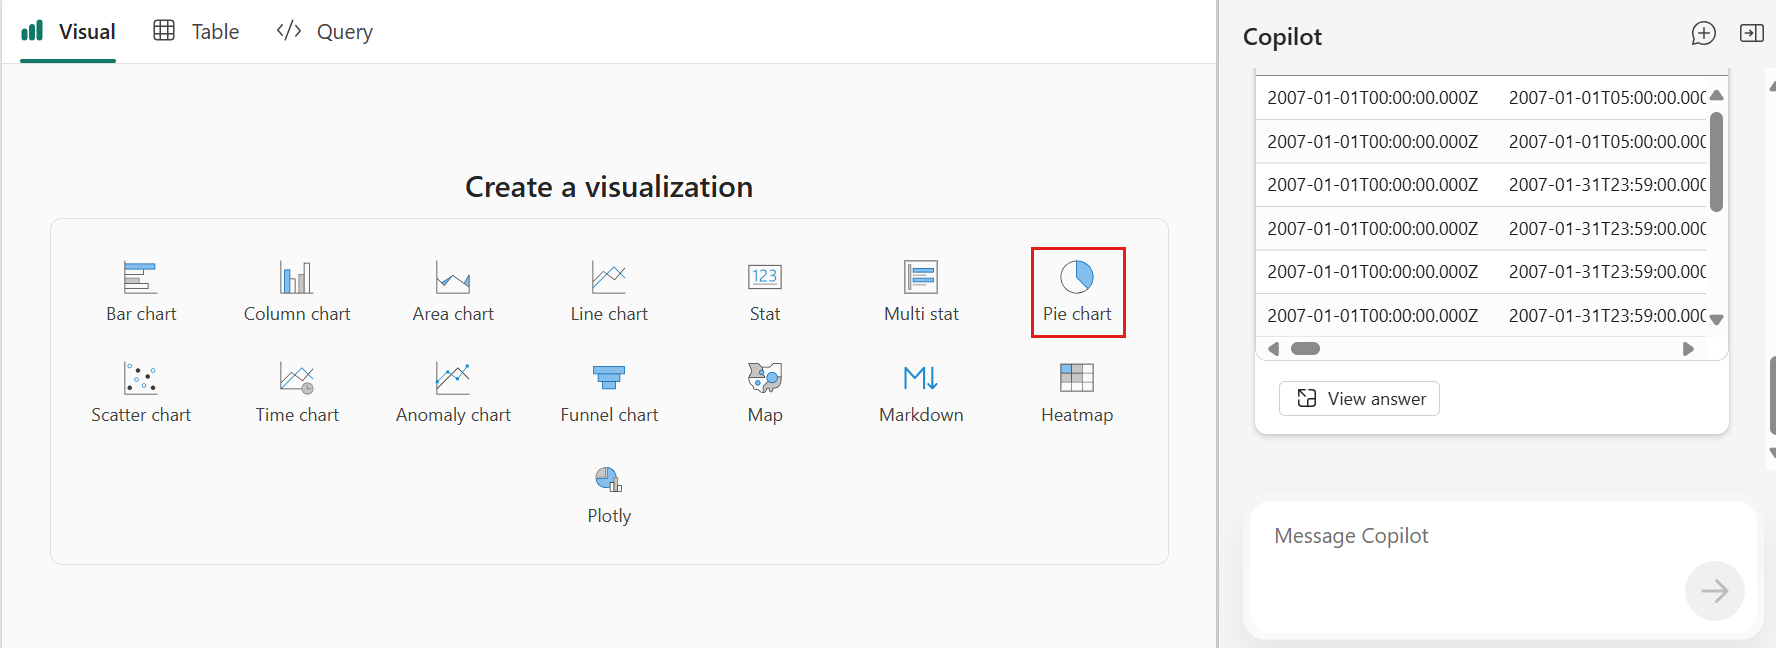
A Copilot dialog opens, so you can ask questions and explore insights specific to that visual's data. To help you get started, the dialog includes suggested queries.

After asking questions and exploring the data, a side pane appears displaying your prompt, the results of your queries, and any generated visuals. This pane allows you to review the insights before deciding to save them to the dashboard or share them with others.

Select Save to dashboard to save the insights as a new visual on the dashboard. You can also save the visual to a different existing dashboard or create a new dashboard for the visual.


Share Copilot exploration insights
After you explore data and find insights by using Copilot, share those insights with others by sharing a link to the insight's query. When others open the link, they see the query and results you have. You can optionally include the visual in the shared insights.
Select the share icon in the Copilot pane or in the expanded view.

In the share dialog, choose whether to include the visual in the shared insights, and then select Copy link.

Share the copied link with others. When they open the link, they see a read-only view of the results and visual, if included. They can do the following tasks with the shared insights:
- Save the query to an existing or new KQL Queryset.
- Run the query, share it again, save to either a new or existing dashboard, and more.
- If the visual is included, they can modify the visual type and customize it.

